Amateur Extra Question E9G07
E9G: The Smith chart
On the Smith chart shown in Figure E9-3, what is the only straight line shown?
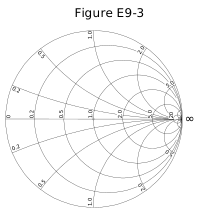
- The reactance axis
- The current axis
- The voltage axis
- The resistance axis (correct answer)
Correct answer: D, The resistance axis
Explanation
A Smith chart plots normalized impedance. Circles of constant resistance and arcs of constant reactance all curve toward the point at the right edge. The only exception is where reactance is zero: the horizontal diameter in Figure E9-3, marked 0, 0.2, 0.5, 1.0, 2.0, 5.0, 20 and ∞. Every point on it is purely resistive, so this straight line is the resistance axis. Its center, 1.0, is a perfect match.
Why the other answers are wrong
- A, The reactance axis: Reactance is read along curved arcs that sweep from the outer circle toward the right edge, not along a straight line; the only straight line is where reactance is zero.
- B, The current axis: A Smith chart plots resistance and reactance, which are parts of impedance. It has no current axis at all.
- C, The voltage axis: The chart shows impedance, not voltage. Standing-wave voltage ratios come from circles drawn around the center, not from a voltage axis.